In the first few months, the KIMoDIs project focused on the design of an intelligent data management system and the collection and processing of available data from the pilot regions. This process is of crucial importance, as a comprehensive and high-quality data basis is a prerequisite for the development of data-driven machine learning (ML) models.
Together with all project partners, the required data and its sources were first identified. This essentially includes groundwater levels and electrical conductivity as a proxy for groundwater salinization, but also abstraction rates, water rights, water levels and atmospheric model variables as well as remote sensing data. The aim is to bring all this data together in an intelligent data management system.
The initial focus was on data processing in the federal state of Brandenburg and the island of Langeoog. Geogenic salinization of freshwater aquifers occurs in both pilot regions, but due to different causes. In Brandenburg, salinization results from the rise of highly mineralized deep waters and salt dome leaching, while on the island of Langeoog it is caused by the intrusion of seawater. In the federal state of Brandenburg, almost 29% of the area is affected by geogenic groundwater salinization. For this reason, the responsible state offices (LfU and LBGR) operate two separate saline monitoring networks. The geogenic monitoring network, which is located far from the surface, is equipped with data loggers and records electrical conductivity, temperature and water level (LBGR). The near-surface, water management-oriented monitoring network comprises groundwater quality measuring points that are sampled approximately every six months in order to monitor the quality of the groundwater (LfU). In addition, the groundwater level is recorded at least once a week at around 2000 groundwater measuring points. On the island of Langeoog, there are over 100 groundwater measuring points where the groundwater level and quality are monitored manually. Around 25 of these measuring points are equipped with data loggers that continuously measure electrical conductivity, temperature and water level.
The first step was to compile and process the raw data from the various pilot regions. Data preparation included steps such as the interpolation of small data gaps and aggregation to uniform time intervals. In addition, automated quality controls were carried out to check the plausibility of the data and make corrections where necessary (correction of outliers or jumps). In parallel to these data preparation measures, the design and technical implementation of a database system in PostgreSQL was driven forward. Modern standards such as the SensorThings API, GroundWaterML 2 and Geographic Markup Language (GML) were used. This database will initially be used for data exchange between the individual project partners. In the future, it will form the basis for the decision support system to be developed.
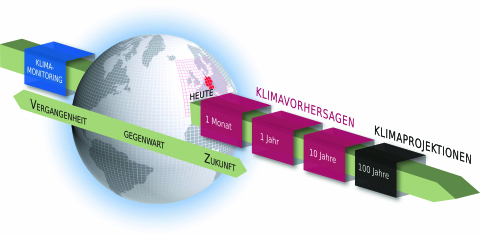
In addition to groundwater monitoring, atmospheric climate data (such as temperature, precipitation, relative humidity) form another key model component. The data-driven ML models learn the complex relationships between groundwater levels and atmospheric parameters. This makes it possible to make short-term (seasonal) and medium-term (1-10 years) forecasts of groundwater levels based on seasonal and decadal climate predictions. Climate projections are used for long-term forecasts up to the year 2100 (Figure 1). The seasonal and decadal climate projections of temperature, precipitation and humidity for the coming months and years have been published as a new data product and are available to everyone on the DWD's ESGF node.
This extensive database can now be used to develop the first ML models that use artificial intelligence to predict groundwater levels and salinization.
Status: 04.09.2023


